HTML
HTML  CSS
CSS  PHP
PHP  JavaScript
  SQL
SQL  Bootstrap
  Solidity
  jQuery
  Git
Git  Chrome DevTools
  C++
C++  Python
 TL;DR – Pandas groupby is a function in the Pandas library that groups data according to different sets of variables. In this case, splitting refers to the process of grouping data according to specified conditions. Applying refers to the function that you can use on these groups. Combining means that you form results in a data structure.
Contents
What is the Pandas groupby function?
Pandas groupby is a function for grouping data objects into Series (columns) or DataFrames (a group of Series) based on particular indicators. In simpler terms, group by in Python makes the management of datasets easier since you can put related records into groups.
Note: essentially, it is a map of labels intended to make data easier to sort and analyze.
Using the groupby function: syntax rules
The basic Python groupby syntax typically consists of clauses such as from, group by, select, and aggregation.
To understand what each of them means, let’s first look at the syntax:
Table_name.groupby(['Group'])['Feature'].aggregation()Which can be broken down into these parts:
Table_name: this would be the name of the DataFrame, the source of the data you are working on.groupby: the group by in Python is for sorting data based on different criteria. In this case, the condition isGroup.Feature: the part of the data or feature you want to be inserted in the computation.aggregation(): the specific function name or aggregation you wish to execute with this operation.
Note: before using Python
groupbyfunction, you need to prepare the Pandas library. For instance, you can get Anaconda, and most of the necessary modules are already installed.
Splitting, applying and combining
- Easy to use with a learn-by-doing approach
- Offers quality content
- Gamified in-browser coding experience
- The price matches the quality
- Suitable for learners ranging from beginner to advanced
- Free certificates of completion
- Focused on data science skills
- Flexible learning timetable
- Simplistic design (no unnecessary information)
- High-quality courses (even the free ones)
- Variety of features
- Nanodegree programs
- Suitable for enterprises
- Paid Certificates of completion
- A wide range of learning programs
- University-level courses
- Easy to navigate
- Verified certificates
- Free learning track available
- University-level courses
- Suitable for enterprises
- Verified certificates of completion
How to split using Pandas groupby?
Splitting with groupby works by dividing a DataFrame into several categories and assigning labels to each one.
Note: frequently, developers mention split-apply-combine technique. It means that you divide your data into groups based on specific conditions, then you apply some changes to each group and combine old and new data.
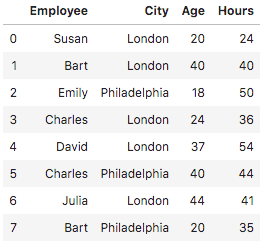
In the following example, we are creating a DataFrame with some information about employees (their age, city, and hours they have worked):
import pandas as pd
import numpy as np
df = pd.DataFrame( {
"Employee" : ["Susan", "Bart", "Emily", "Charles", "David", "Charles", "Julia", "Bart"] ,
"City" : ["London", "London", "Philadelphia", "London", "London", "Philadelphia", "London", "Philadelphia"] ,
"Age" : [20, 40, 18, 24, 37, 40, 44, 20 ],
"Hours" : [24, 40, 50, 36, 54, 44, 41, 35]} )
df
In the next snapshot, you can see how the data looks before we start applying the Pandas groupby function:
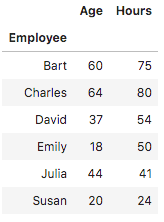
Now, we can use the Pandas groupby() to arrange records in alphabetical order, group similar records and count the sums of hours and age:
df.groupby(['Employee']).sum()Here is an outcome that will be presented to you:
Applying functions with groupby
In this example, we will use this Python group by function to count how many employees are from the same city:
df.groupby('City').count()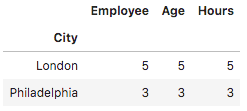
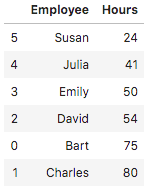
In the following example, we add the values of identical records and present them in ascending order:
df.groupby('Employee')['Hours'].sum().to_frame().reset_index().sort_values(by='Hours')Here is the output:
You can also import matplotlib.pyplot to visualize your data in graphs. For instance, the following example visualizes the age and hours from the table. Add the following code to the first example before visualizing data:
import matplotlib.pyplot as pltThe following code will put data into a bar chart:
plt.clf()
df.groupby('Employee').sum().plot(kind='bar')
plt.show()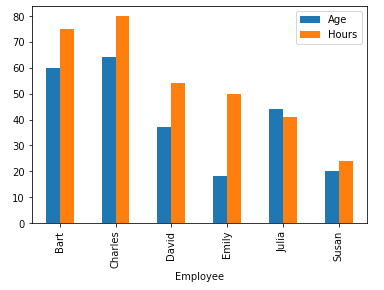
The next example will display values of every group according to their ages:
df.groupby('Employee')['Age'].apply(lambda group_series: group_series.tolist()).reset_index()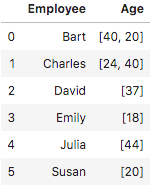
The following example shows how to use the collections you create with Pandas groupby and count their average value. It keeps the individual values unchanged.
df.groupby(['Employee']).mean()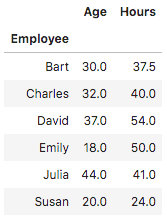
You can also find the number of even numbers in your groups. However, before you can complete this task with the Python group by function, you need to define the method for it to work:
def count_even_numbers(series):
  return len([elem for elem in series if elem % 2 == 0 ])
df.groupby('Employee')['Age'].apply(count_even_numbers).reset_index(name='num_even_numbers')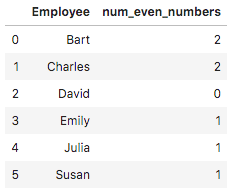
Filtering
You can filter data according to the age of people as well. For instance, this code will only include people that are younger than 30:
df_filtered = df.query('Age < 30')
print(df_filtered)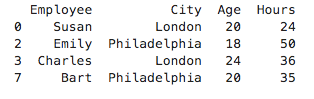
The filtering operation selects data groups by using true/false conditions. Here’s another example of a simple DataFrame that consists of employee, salary, and year variables:
import pandas as pd
import numpy as np
df = pd.DataFrame( {
"Employee" : ["Susan", "Kevin", "Charles", "David", "Ben"] ,
"Salary" : [60000, 35000, 31000, 10000, 20000] ,
"Year" : [2019, 2019, 2019, 2019, 2019]} )
df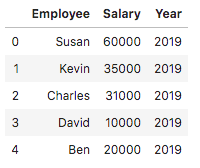
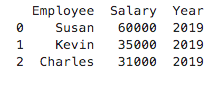
The following code will filter employees according to their salary:
df_filtered = df.query('Salary > 30000')
print(df_filtered)
Here is the output after we apply the filtering function:
Combining results
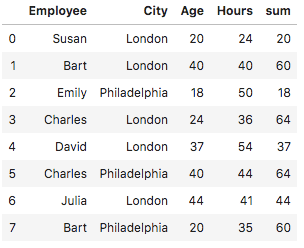
You might need to group data, apply a specific function on these collections, and then place it with the original data. For this purpose, you can use transform(). In the following example, we are grouping employees according to their age, adding values together and including a column of the sum to the table:
df['sum']=df.groupby(['Employee'])['Age'].transform('sum')
df