 HTML
HTML  CSS
CSS  PHP
PHP  JavaScript
  SQL
SQL  Bootstrap
  Solidity
  jQuery
  Git
Git  Chrome DevTools
  C++
C++  Python
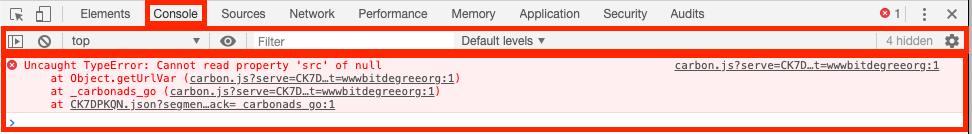
 Even though changing styles on websites is a valuable feature of Chrome Developer Tools, it can also help you find bugs in JavaScript code. The JavaScript console in DevTools is considered to be a suitable place for beginners to practice their code-writing skills. However, experienced developers can take advantage of the Chrome JavaScript console to review diagnostic information of their websites.
JavaScript console in the Chrome DevTools is used by developers to debug JavaScript, analyze DOM and HTML errors. As soon as you open the Chrome JavaScript console, you will be introduced to mistakes on the page you are viewing. In this tutorial, we will review the Console panel in detail.
Diagnostic information about websites is retrieved from the list of JavaScript console log. It will automatically display the most important ones, but you can go that extra mile and filter them.
In this tutorial, we will quickly review the information types you can receive from the Chrome JavaScript console. For example, the JavaScript console will display the Network issues that you need to solve.
A very convenient feature of the Console panel is the autocompleting commands. While you JavaScript write to console, a dropdown menu will appear, containing the possible commands you can choose.
If you want to analyze diagnostic information on-the-go, we highly recommend you to learn how to open console in Chrome and begin fixing errors in your website!
Contents
Chrome DevTools Console: Main Tips
- This tutorial will provide a brief overview of the Console panel of the Chrome Developer Tools.
- The Console panel is used to see diagnostic information through logs and interact with the JavaScript of the page you are visiting.
- For beginners, the Console can be used as a sandbox for learning JavaScript.
Console Panel Explained
For starters, the Console panel's interface is quite simple.
The biggest part of the JavaScript console is taken up by the console logs and by the space to write JavaScript commands. Above, you should notice the various options for filtering the log content.
Additionally, in the Console panel, you can inspect the provided diagnostic information and run JavaScript code to interact with the page you are on.
- Easy to use with a learn-by-doing approach
- Offers quality content
- Gamified in-browser coding experience
- The price matches the quality
- Suitable for learners ranging from beginner to advanced
- Free certificates of completion
- Focused on data science skills
- Flexible learning timetable
- Simplistic design (no unnecessary information)
- High-quality courses (even the free ones)
- Variety of features
- Nanodegree programs
- Suitable for enterprises
- Paid Certificates of completion
- A wide range of learning programs
- University-level courses
- Easy to navigate
- Verified certificates
- Free learning track available
- University-level courses
- Suitable for enterprises
- Verified certificates of completion
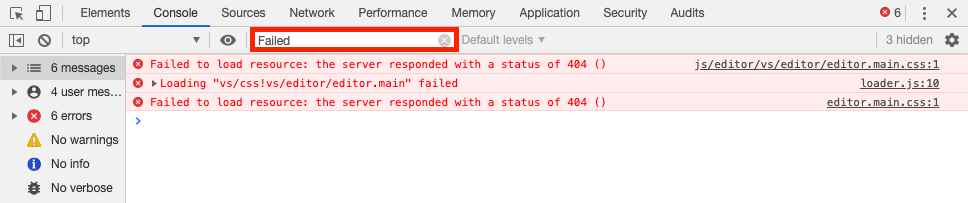
Ways to Filter Logs
By default, the Console panel will filter out certain things to display only relevant logs.
However, you might need to see more of them or to analyze specific diagnostic information.
To filter the logs you receive, you have a few options.
Firstly, in the Filter bar, you can enter a keyword. Then it will only display logs that contain the selected word or phrase.
You also have the drop-down located to the right. By clicking on this menu, you can select what kind of messages should be displayed in the Console panel.
By default, it shows messages that fall to the categories of Info, Warning and Errors, and omitts Verbose messages.
For you to understand everything better, we have to explain what these categories mean:
- Info shows output only from
console.info() - Warning shows output only from
console.warning() - Errors shows output only from
console.error() - Verbose shows output only from
console.verbose()
You can also set the context that console commands execute in. This is done using the drop-down menu on the left.
By default, the context is top, meaning that the page loading is complete. You have options based on the extensions in your browser (the iframes in your page, Web workers running in the background).
Once you understand these principles, you might want to use different contexts to get values that only exist in a specific context (separate from the default one or vice versa).
Settings Interface: Change Console Output
You can open the Settings interface for the Console by clicking the cog icon in the upper right corner of the panel.
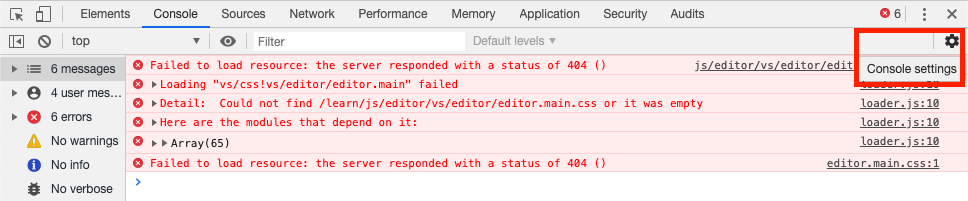
Here you can modify the console output among a few other things.
Firstly, look at this list, describing each of the options:
- Hide Network: by default, the console displays messages about network issues. With this setting on, the log will not display errors such as 404 or 500.
- Preserve Log: keeps the logs that pop up on the current window throughout navigation and refreshes.
- Selected Context Only: only shows messages from the selected content (top, iframe, worker, extension).
- User Messages Only: only shows messages that are using the API methods for display.
- Log XMLHttpRequests: logs XMLHttpRequests the page makes.
- Show Timestamps: disables message stacking and shows timestamps for each message.
- Autocomplete from History: autocompletes the log based on previous messages.
Chrome DevTools Console: Summary
- This tutorial introduced readers with the main features, categories, options and settings of the JavaScript console.
- This panel is designed to provide diagnostic information about websites. For efficiency, the panel displays the most relevant logs right away.
- Additionally, it is a place for experiments as developers can run JavaScript code on their websites.
- The Console panel is a suitable place for learning and practicing JavaScript from scratch.
