 HTML
HTML  CSS
CSS  PHP
PHP  JavaScript
  SQL
SQL  Bootstrap
  Solidity
  jQuery
  Git
Git  Chrome DevTools
  C++
C++  Python
 The Network panel of Chrome Developer Tools is used to find and solve network issues to optimize websites. As soon as you open DevTools, Chrome Network tab will begin recording all network requests which you can later sort by different properties.
You can stop this recording process manually. However, it will end automatically as soon as you refresh the page you are visiting. Therefore, the Networks panel could be considered as one of the network testing tools.
All of the recorded requests are kept in the Network log. Some web developers might be asking themselves a question: why is my website slow?
If visitors have to wait a long time for a page to load, they will leave and never look back. To attract people to your website, you have to make sure that the website performance is top-notch.
To solve such a performance issue, you can start by analyzing the network activity and detecting possible causes. However, please remember that many factors might cause a slow response time. You probably won’t be able to optimize your website only with the Network panel.
One of the possible problems that you can detect in the Chrome Network tab is whether resources are correctly handled. Also, if you want to implement monitor response time test, Network panel will help you complete simulations to analyze how your webpage loads in slower computers.
Contents
Chrome DevTools Network: Main Tips
- In this tutorial, we are going to take a look at the Network panel of the Chrome Developer Tools.
- This panel is used to analyze network performance and to record requests as long as DevTools are open (or as long as you don’t intentionally stop the recording process).
Network Panel Explained
The Chrome Network tab records all network requests as long as DevTools are open.
The recording starts when Chrome Developer Tools are opened. You can also press the red glowing icon to stop recording. If you have stopped this process, you need to click on that button again to restart it:
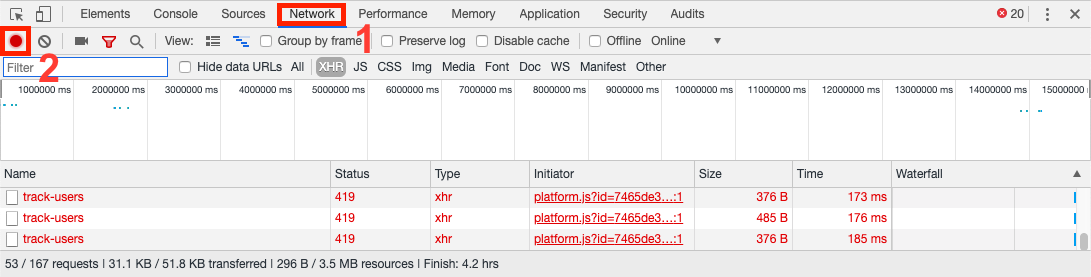
Just by looking at the interface of this panel, you can see that there are more options for recording network performance with the Chrome Network tab.
From left to right, the buttons shown in the image above are described in this list:
- Stop/start Recording Network Log: if the button is red, stop the recording process by clicking it. If it is gray, click the button to start recording .
- Clear: clears the previously recorded requests.
- Capture Screenshots: by selecting this and reloading the page, you will receive screenshots, showing which elements of the page load first and which take longer.
- Filter: toggles the visibility of the filter interface.
- Use Large Request Rows: toggles between larger and smaller rows for displaying the data of the requests.
- Hide Overview: toggles the visibility of the Waterfall graph.
- Group by Frame: groups the requests according to what frame they belong to (you can check what frames are present overall in the Console panel).
- Preserve Log: makes the log persist throughout navigation and reloads.
- Disable Cache: disables the use of the cache to simulate loading the page for the first time.
- Offline: simulates the offline browsing experience.
There are also ways to simulate different kinds of connections to see how the page loads on different networks. Therefore, you can complete monitor response time test to find whether visitors with slower computers have to wait a long period of time for your website to load.
Content of Log Table
This log displays the requests' data in a table, consisting of these properties:
- Name: file name of the resource or its identifier.
- Status: code of the HTTP status.
- Type: requested resource's MIME type.
- Initiator: the initiator of the request. Here are the potential processes and objects that may fall into this category:
- Parser: the HTML parser of Chrome.
- Redirect: redirecting the HTTP.
- Script: JavaScript code.
- Other: navigating, entering URLs, processes or actions that can initiate a request.
- Size: combined size of the header and body of the response, according to the server.
- Time: the time passed since the initiation of the request to the last byte sent by the server.
- Waterfall: visual representation of the request's activity.
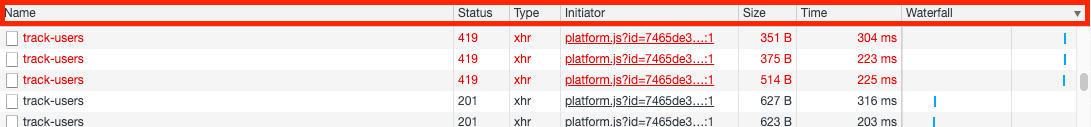
By right-clicking the header of the table, you can also select and deselect which columns should be displayed.
- Easy to use with a learn-by-doing approach
- Offers quality content
- Gamified in-browser coding experience
- The price matches the quality
- Suitable for learners ranging from beginner to advanced
- Free certificates of completion
- Focused on data science skills
- Flexible learning timetable
- Simplistic design (no unnecessary information)
- High-quality courses (even the free ones)
- Variety of features
- Nanodegree programs
- Suitable for enterprises
- Paid Certificates of completion
- A wide range of learning programs
- University-level courses
- Easy to navigate
- Verified certificates
- Free learning track available
- University-level courses
- Suitable for enterprises
- Verified certificates of completion
Ways to Sort Requests
An important thing to know about the Chrome Network tab is how requests are sorted.
By default, they are sorted by initiation time: the earliest is found at the top, the latest on the bottom.
However, there are more ways to sort requests:
- By column: select the column you want to sort the requests by.
- By activity phase: this is done by right-clicking the header of the table and navigating to Waterfall. From there, you have a few more options:
- Start time: default setting. The earliest initiated request goes first.
- Response time: the request that starts downloading the earliest goes first.
- End time: the request that is finished first goes to the top.
- Total duration: the request that took the least time to finish goes first.
- Latency: the request that got its response first is displayed on top.
Waterfall: Inspect Network Performance
The Waterfall graph is simple enough and can be used as a timeline to track requests.
It provides a visual representation of how long the requests spent in the queue, how long it took to get the response and to download the resources.
Additionally, when you hover over one of the queues inside the graph, it will display in-depth information about it like this:
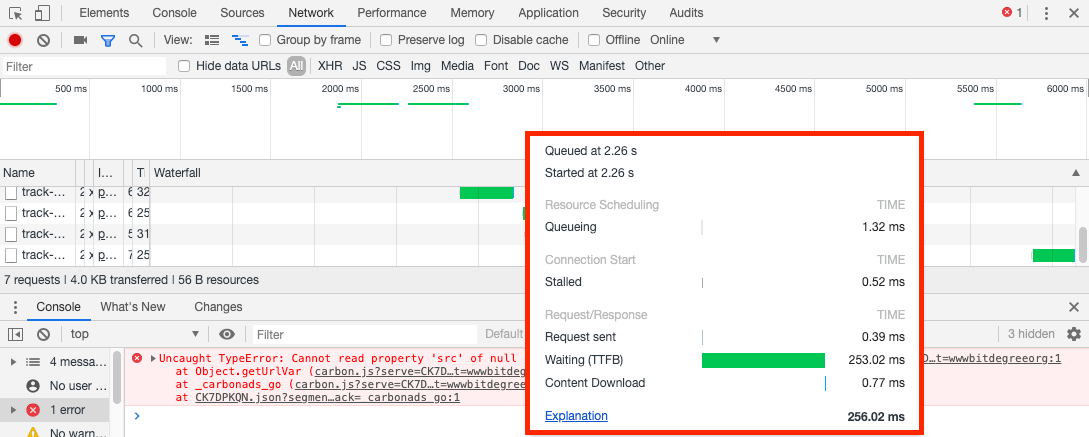
Therefore, Waterfall is a very powerful and convenient tool for analyzing network performance.
Another useful feature of the Waterfall graph is the ability to narrow down the scope of requests that are displayed to a certain point in the timeline.
To do this, simply drag from one point in the timeline to another.
Chrome DevTools Network: Summary
- This tutorial explained the most important aspects of the Network panel of the Chrome Developer Tools.
- The Network panel can be employed to record all network requests, view their properties and sort them according to your needs.
- This panel also provides Waterfall tool which is used to keep track and manage requests.
