 HTML
HTML  CSS
CSS  PHP
PHP  JavaScript
  SQL
SQL  Bootstrap
  Solidity
  jQuery
  Git
Git  Chrome DevTools
  C++
C++  Python
 Performance panel is all about tracking and optimizing the performance of websites. This panel is a built-in Chrome performance monitor, allowing you to check whether the applied optimization strategies improved the website’s performance.
The Chrome performance monitor is a quick tool to record website performance metrics while a page is running or reloading. That’s right: the panel is meant for measuring the first page load time as well.
You will be able to review and interact with snapshots of recordings. These screenshots will display how a page looked during different stages of the recording process. You can also customize your records by selecting which information they should include.
One of the useful features of this panel is that you can complete a CPU test online. You can make the CPU operate slower and imitate the CPU of mobile devices.
Additionally, the Performance panel can serve as FPS checker since it provides FPS chart, consisting of information about FPS during the recording process.
While the Network panel is mostly concerned with the recording of requests, the Chrome performance monitor provides you with a detailed overview of page performance, including network requests, rendering, parsing and JavaScript execution. All of this information is divided into different sections which we will discuss in this tutorial.
Do not hesitate to learn about the Performance panel. It will allow you to get website performance metrics and find out what options you have for optimizing your website speed!
Contents
Chrome Performance: Main Tips
- In this tutorial, we are going to take a look at the Performance panel of the Chrome Developer Tools.
- This panel is used to record and analyze runtime performance.
Performance Panel Explained
The Performance panel of the Chrome DevTools records runtime performance data.
You start recording when you open Developer Tools and press the RECORD button in the Chrome Performance tab.
Then, the panel records the runtime performance to create its profile. You can also stop the recording before it is finished.
During the recording process, you should interact with the page to record the performance during those interactions for later analysis.
By clicking the RELOAD button, you will start measuring page load time. It will record the page while it is reloading and a few seconds after this process is finished.
Note that DevTools zooms in on the portion of the most active recording.
You also have the option to force garbage collection while recording. You can use this option by selecting the garbage bin icon.
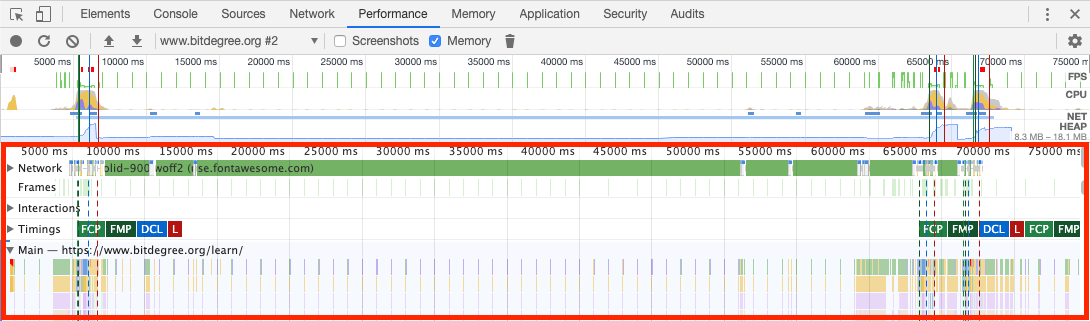
Here is an example of what the Chrome Performance tab will display after creating a performance profile of a page:

On top, you can notice a timeline, showing how much activity occurred at any point during recording. This information is based on:
- FPS (frames per second).
- CPU usage.
You can also capture Screenshots while recording. This will record every frame of the page while you're interacting or reloading it. You can disable the screenshot-taking feature if you want a more speedy performance evaluation.
You can view screenshots by hovering over or selecting them under the timeline.
- Easy to use with a learn-by-doing approach
- Offers quality content
- Gamified in-browser coding experience
- The price matches the quality
- Suitable for learners ranging from beginner to advanced
- Free certificates of completion
- Focused on data science skills
- Flexible learning timetable
- Simplistic design (no unnecessary information)
- High-quality courses (even the free ones)
- Variety of features
- Nanodegree programs
- Suitable for enterprises
- Paid Certificates of completion
- A wide range of learning programs
- University-level courses
- Easy to navigate
- Verified certificates
- Free learning track available
- University-level courses
- Suitable for enterprises
- Verified certificates of completion
Flame Chart in Threads
Below the timeline (revealing the activity levels and screenshots), different threads are shown. You can select and expand them.
In these threads, you can inspect particular events that are displayed in a flame chart, which looks something like the screenshot below. Here we have selected the main thread:
In the chart, you can zoom in by using the scroll wheel and look around by dragging around with the mouse.
You may then select the events from the flame chart to inspect them:
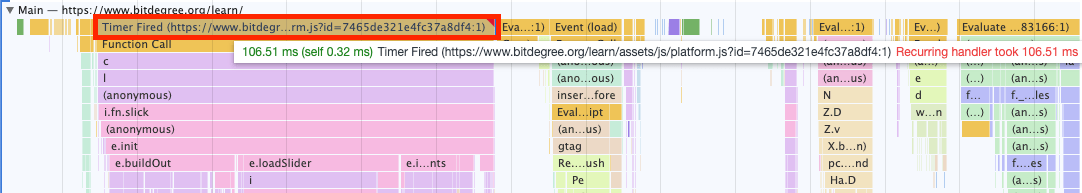
In the Summary pane, you can review the information about how much time the event took for different things (as well as its range).
Options for Filtering Recordings
Additionally, there is a selection of various options for filtering the recordings.

These options include:
- Disable JavaScript Sample: disables sampling to provide a runtime performance recording that is shorter and more condensed.
- Network: similarly to the Network panel, you can use different presets to simulate faster and slower network types.
- Throttling: this option allows you to simulate running the website on a computer that is 2x or 4x slower than your computer's usual speed. You can see how the website runs on slower computers.
- Enable Advanced Paint Instrumentation: allows you to inspect Paint events.
Additionally, you can save profiles for later comparison, as well as clearing the current profile manually.
Chrome Performance: Summary
- This tutorial reviewed the essential principles of the Performance panel of Chrome Developer Tools.
- This panel serves the purpose of monitoring runtime performance and providing information about FPS and CPU usage.
- You can also customize the performance recordings you receive by making them shorter, by manipulating network types or by running your website on slower computers.
