 HTML
HTML  CSS
CSS  PHP
PHP  JavaScript
  SQL
SQL  Bootstrap
  Solidity
  jQuery
  Git
Git  Chrome DevTools
  C++
C++  Python
 The Console panel of Chrome Developer Tools offers a variety of functions that developers or curious Internet visitors can exploit to improve websites. The Chrome Command Line API will help you achieve highly practical tasks in the easiest, time-saving way possible.
Some of the Chrome Console commands that we review in this tutorial are closely-related to the ones we discussed in the Console API tutorial.
You can consider the Chrome Command Line API as an instrument for you to inspect and select DOM elements, and start or end the JavaScript CPU profiling session. Selectors also play a huge role. Because of them, you can quickly find the needed objects or elements. For instance, you can quickly find the last evaluated expression.
However, the functionality does not end here. Thanks to convenient Chrome commands in this API, you can also keep track of DOM events, clear the history of the console and move object string representations to clipboard.
Furthermore, you can use functions that could be labeled as Source Console commands because they break functions on the Source panel and make debugging possible.
Chrome Command Line API also allows you to navigate between different panels quickly. Specific functions or objects will be opened in their corresponding tabs. For instance, DOM elements are displayed in the Elements panel.
If all of this seems complicated, no need to worry: this tutorial explains all of the functions in great detail!
Contents
- 1. Chrome Command Line API: Main Tips
- 2. Command Line API Explained
- 3. Selectors for Objects and Elements
- 3.1. $_
- 3.2. $0 - $4
- 3.3. $(selector)
- 3.4. $$(selector)
- 3.5. $x(path)
- 4. Main Functions Described
- 4.1. clear()
- 4.2. copy(object)
- 4.3. debug(function)
- 4.4. undebug(function)
- 4.5. dir(object)
- 4.6. dirxml(object)
- 4.7. inspect(object/function)
- 4.8. getEventListeners(object)
- 4.9. keys(object)
- 4.10. values(object)
- 4.11. monitor(function)
- 4.12. unmonitor(function)
- 4.13. monitorEvents(object, [events, ...])
- 4.14. unmonitorEvents(object, [events, ...])
- 4.15. profile([name])
- 4.16. profileEnd([name])
- 4.17. table(data, [columns, ...])
- 5. Chrome Command Line API: Summary
Chrome Command Line API: Main Tips
- In this tutorial, we reveal the various functions the Chrome Command Line API of DevTools provides.
- There is a collection of functions you can use on the Chrome DevTools Console panel to quickly perform common tasks.
Command Line API Explained
The functions in the Command Line API of the Chrome Developer Tools help to implement common tasks.
By utilizing such Chrome Console commands, you can:
- Select and inspect DOM elements.
- Display data in a format that can be read.
- Stop and start the profiler tool.
- Monitor DOM events.
We will go over these events one by one and briefly explain them and their usage.
Selectors for Objects and Elements
Chrome commands allow you to select various objects and DOM elements.
$_
This will return the expression, evaluated the most recently.
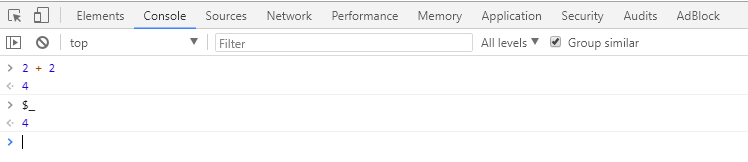
It may contain anything from simple values to objects with their own properties.
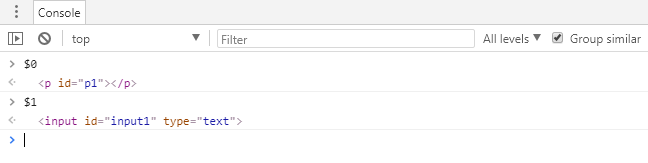
$0 - $4
These functions refer to the history of what you have selected in the DOM interface of Elements panel.
$0 function returns the last selected element, $1 returns the second most recently selected one, $2 the third recently selected one and so on.
The elements are returned in a collapsed form of the same HTML that you selected them.
$(selector)
This will return the first element that has the corresponding CSS selector.
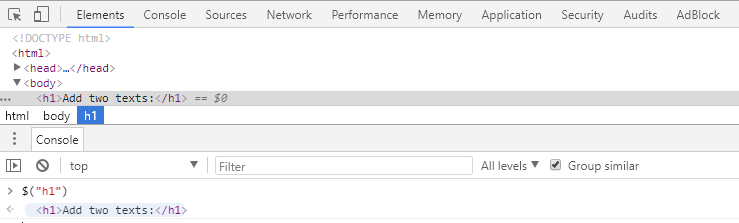
It is an alias for the document.querySelector() function.
Warning: This may conflict with the jQuery library, which uses the $ symbol too, meaning it may be overwritten. Learn how to work around this here.
$$(selector)
This will return all elements that contain the corresponding CSS selector.
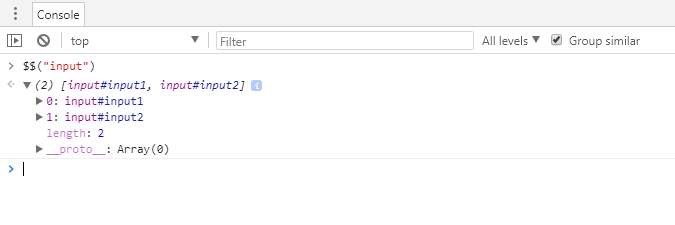
Essentially, this selector works the same as document.querySelectorAll() function.
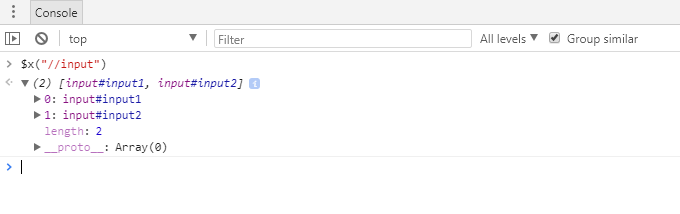
$x(path)
Based on the XPath expression you provide, this will return an array of elements.
We should also explain the XPath and its usage.
Simply put, XPath is used to select nodes and node sets, based on the indicated expressions.
You can review the possible expressions to provide:
| Expression | What it does |
|---|---|
| node | Select all nodes that have the specified node name |
| / | Select from the root element. Starting the path with this will mean the expression as a whole represents an absolute path |
| // | Select elements from the node the path is currently selecting from, regardless of their location |
| . | Select the current node |
| .. | Select the parent node of the current node |
| @ | Select attributes |
For example, typing the command with the XPath expression '//a' would select all links in the document.
Main Functions Described
Now that we have the selectors explained, we can get to the functions. Many of them are similar to the ones that the Console API provides.
clear()
This function clears the console.
clear()
copy(object)
It allows you to copy a string representation of the object you selected into the clipboard.
copy(object)
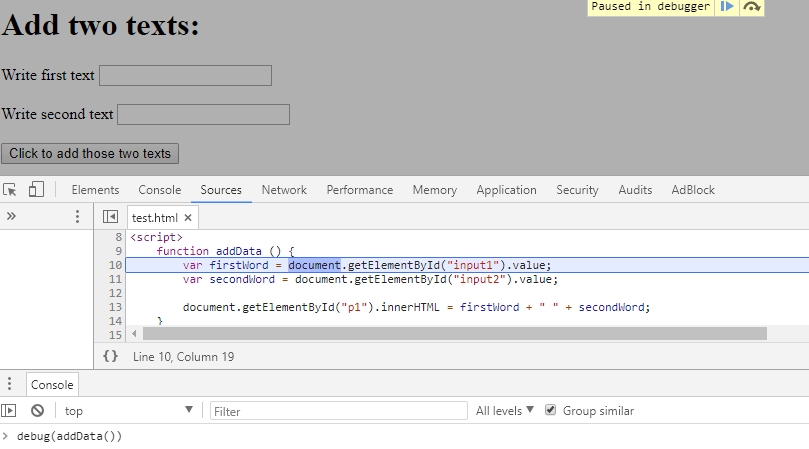
debug(function)
Once the function you specify in the brackets is called, the debugger is initiated and breaks the function inside the Sources panel. This is one of the Source Console commands that we mentioned before. After it is implemented, you can analyze the code and debug it.
debug(function)
undebug(function)
Stop the debugging of the function (if debug() has been called), so the debugger does not get invoked once the function starts executing.
undebug(function)
- Easy to use with a learn-by-doing approach
- Offers quality content
- Gamified in-browser coding experience
- The price matches the quality
- Suitable for learners ranging from beginner to advanced
- Free certificates of completion
- Focused on data science skills
- Flexible learning timetable
- Simplistic design (no unnecessary information)
- High-quality courses (even the free ones)
- Variety of features
- Nanodegree programs
- Suitable for enterprises
- Paid Certificates of completion
- A wide range of learning programs
- University-level courses
- Easy to navigate
- Verified certificates
- Free learning track available
- University-level courses
- Suitable for enterprises
- Verified certificates of completion
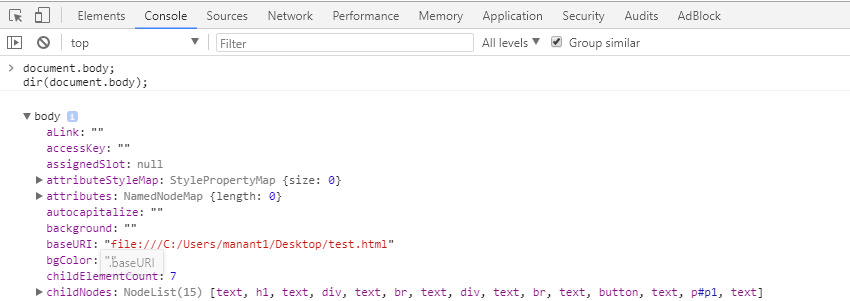
dir(object)
Alias for the console.dir() function.
It displays properties of JavaScript objects or DOM elements in a list.
dir(object)
dirxml(object)
It has the same function as the console.dirxml() command.
It shows an XML representation of the selected object, as depicted in the Elements panel.
dirxml(object)
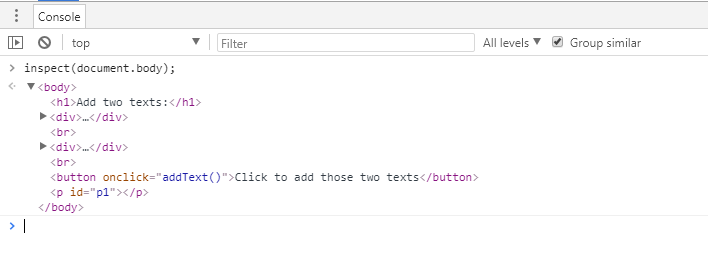
inspect(object/function)
This is used to open and select specified objects or functions in the corresponding panels.
For example, if you select a DOM element, it will be displayed in the Elements panel.
If a function is specified, the file (containing the function) will be opened in the Sources panel.
inspect(object/function)
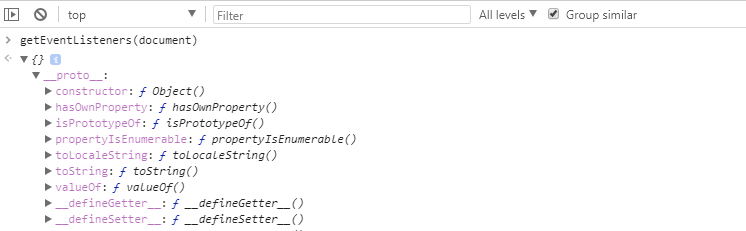
getEventListeners(object)
Use this to return the event listeners that are registered on objects, passed as parameters.
If multiple listeners are registered for one object, you will receive an array, containing a member of every listener.
Objects can be expanded to view their details.
getEventListeners(object)
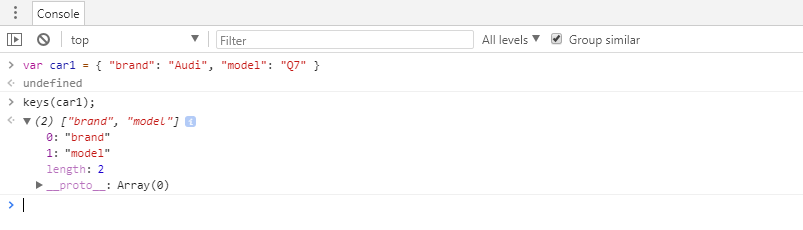
keys(object)
This object displays properties of the specified object.
keys(object)
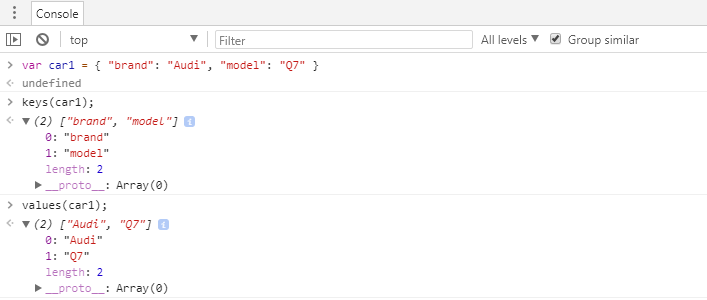
values(object)
This object shows the property values of the specified object.
values(object)
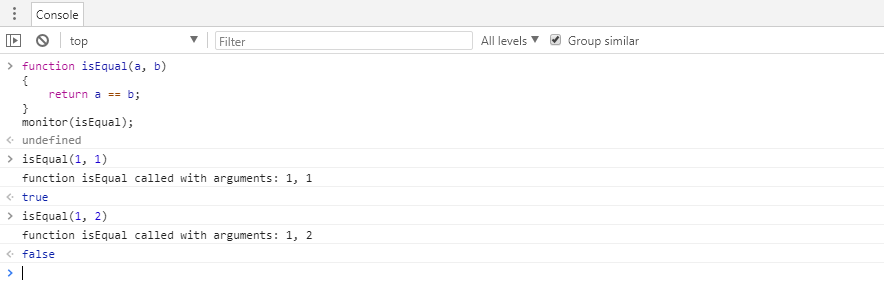
monitor(function)
Allows you to start monitoring a function.
After you run this function, the console is set to log whenever the specified function is called. This log also specifies the parameters the function was called with.
monitor(function)
unmonitor(function)
It allows you to stop monitoring a function.
unmonitor(function)
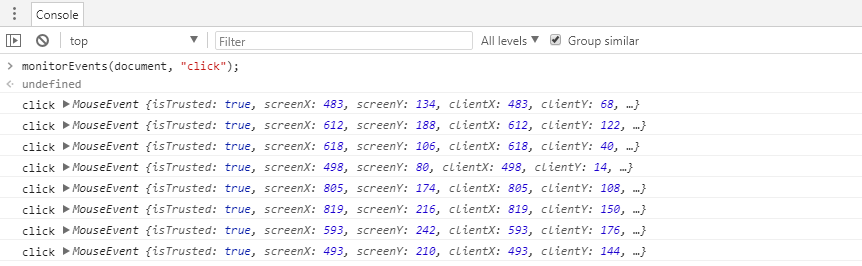
monitorEvents(object, [events, ...])
It starts monitoring an object for events.
When an event (or only the specified event if it is passed as a parameter) occurs on the specified object, the event object is logged to the console.
It should also be noted that there are ways to specify a set of events via keywords. This table lists all of them:
| Event type | Specific events it includes |
|---|---|
| mouse | click, dbclick, mouseup, mousedown, mouseover, mousemove, mouseout, mousewheel |
| key | keypress, keydown, keyup, textInput |
| touch | touchmove, touchstart, touchend, touchcancel |
| control | scroll, resize, focus, zoom, select, blur, submit, change, reset |
This how the syntax of this command looks:
monitorEvents(object, [events, ...])
unmonitorEvents(object, [events, ...])
It stops monitoring an object for events.
unmonitorEvents(object, [events, ...])
profile([name])
Begins a profiling session.
The profiling session is used to create a profile, allowing you to inspect the runtime performance by recording the CPU usage by JavaScript.
The profile is then saved to the Memory panel.
profile([name])
profileEnd([name])
Completes the currently running, or the specific currently running, profiling session.
profileEnd([name])
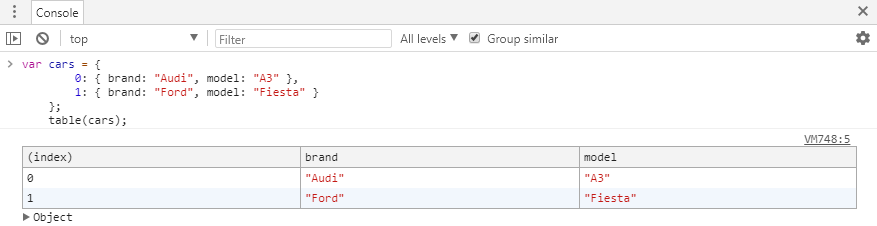
table(data, [columns, ...])
Alias for the console.table() function.
Creates a table from the array of objects you provide.
table(data, [columns, ...])
Chrome Command Line API: Summary
- This tutorial introduced you to the Chrome Command Line API of DevTools.
- There are many functions, designed to simplify the most common tasks developers implement in DevTools: inspecting DOM elements, profiling the CPU usage by JavaScript, monitoring events or functions, and many others.
