 HTML
HTML  CSS
CSS  PHP
PHP  JavaScript
  SQL
SQL  Bootstrap
  Solidity
  jQuery
  Git
Git  Chrome DevTools
  C++
C++  Python
 GNU or GDB debugger is an application for finding out how your C or C++ program runs or for analyzing the moment the program crashes. You can perform many useful tasks with GDB: run the program, stop the program under specific conditions, analyze the situation, make modifications, and test new changes.
Contents
- 1. More on the GDB debugger
- 2. Preparing the GDB debugger for use
- 3. Setting breakpoints to stop the execution of a program
- 4. Running the program slowly
- 5. Printing values of variables and expressions
- 6. Using where and frame commands
- 7. Commands to use in the GDB debugger
- 8. Other C++ debuggers to consider
More on the GDB debugger
You can use GDB as a C++ debugger if a program is written with the GNU compiler and the -g flag. By debugging with GDB, you can catch errors and solve them before they cause severe issues.
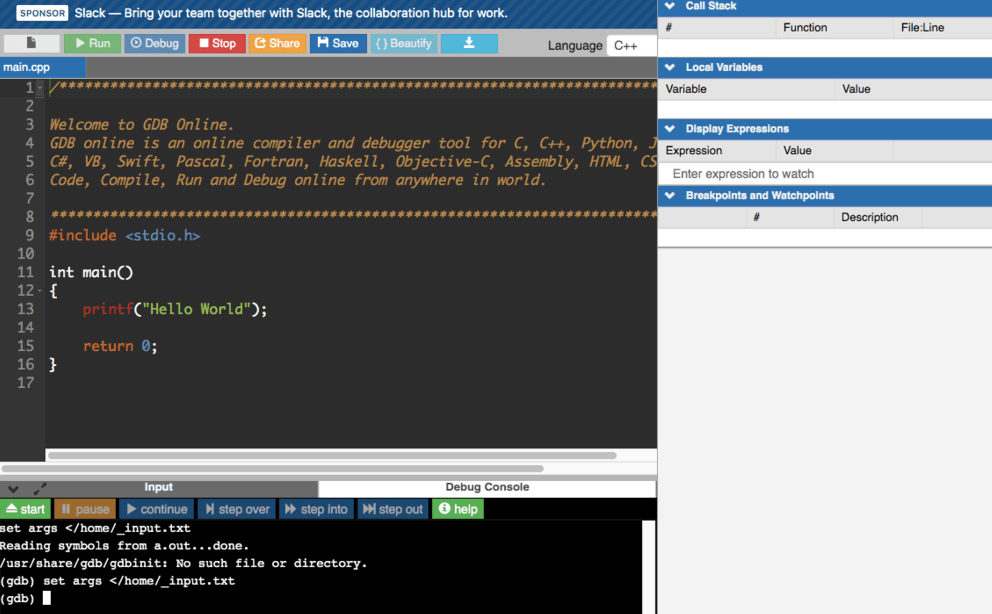
Tip: a quick option is using the onlineGDB debugger, which lets you compile and analyze C++ code online without having to download the debugger to your operating system.
Here is how the onlineGDB debugger looks:
Preparing the GDB debugger for use
The first step of learning how to use GDB for C++ debugging is to compile the C++ code with the -g flag:
$ g++ - g filename.cppThe next step is calling the GDB to start the debugging process for the program you wish to analyze:
$ gdb program_nameNote: for the next functions, the (gdb) part of the command appears automatically.
The code above opens this C++ debugger but does not run the program. There are several ways of running the program you have opened. First, you can execute it with run command:
$ (gdb) runYou can pass arguments if the program needs some command-line arguments to be passed to it:
$ (gdb) run arg1 arg2Debugging with GDB lets you investigate the core file as well. The core file contains information about when a program crashed.
$ (gdb) core filenameNote: by typing the help command, you will learn more about the commands to use in the GDB debugger.
Setting breakpoints to stop the execution of a program
You can debug your C++ program more efficiently if you use breakpoints. Breakpoints refer to instructions that stop the execution at specific moments. For instance, you should set breakpoints in places you suspect to be problematic.
It is possible to set breakpoints in two ways:
- Setting a line at which execution stops.
- Setting a function name to stop execution at.
Note: it is a common practice to set breakpoints before running the program.
The following example sets a breakpoint at the start of the main function:
$ (gdb) b mainThis example sets a breakpoint at a specific line (20):
$ (gdb) b 20This example adds a breakpoint at the beginning of a class member function:
$ (gdb) b list::eraseThis example lists all of the breakpoints:
$ (gdb) info bThe following example deletes a breakpoint at line 20:
$ (gdb) delete 20Note: the GDB debugger accepts abbreviations of commands. Therefore, you can use b instead of break or p instead of print.
Running the program slowly
You might need to execute a program slowly, moving from one function to another. There are two ways of making the program run step-by-step.
next executes the current command, stops, and displays the next function in line for execution.
$ (gdb) nextstep: executes the current command. In cases when it is a function call, it breaks at the beginning of that method. You can use it for looking for errors in nested code.
$ (gdb) step- Easy to use with a learn-by-doing approach
- Offers quality content
- Gamified in-browser coding experience
- The price matches the quality
- Suitable for learners ranging from beginner to advanced
- Free certificates of completion
- Focused on data science skills
- Flexible learning timetable
- Simplistic design (no unnecessary information)
- High-quality courses (even the free ones)
- Variety of features
- Nanodegree programs
- Suitable for enterprises
- Paid Certificates of completion
- A wide range of learning programs
- University-level courses
- Easy to navigate
- Verified certificates
- Free learning track available
- University-level courses
- Suitable for enterprises
- Verified certificates of completion
Printing values of variables and expressions
With the GDB debugger, you can check the values of variables during specific moments of the execution. You will use the print command for this task. It is possible to print more complicated expressions, type casts, call functions, etc.
$ (gdb) print <expression>The possible syntax for using print:
print <exp>: to get values of expressions.print /x <exp>: to get the value of expressions in hexadecimal.print /t <exp>: to get the value of expressions in binary.print /d <exp>: to get the value of expressions as unsigned int format.print /c <exp>: to get the value of expressions as signed int format.
Using where and frame commands
During analysis of code, you might need to check which function currently runs.
$ (gdb) whereBy typing the where command, you will learn these things:
- The name of the currently running function.
- The name of the file in which the function runs.
- The number of the line in which the function is.
- The name of the function that called the current function.
- The arguments the current function had.
- If it is a call chain, you will see all of them.
You can analyze the values of variables local to the calling function (or other function in the stack). The frame command instructs the GDB debugger to work on the specific stack frame or the one you are currently at.
$ (gdb) frameTip: the stack frame shows the sequence of function calls.
frame <frame-num>: sets the current stack frame to the indicated as<frame-num>.info frame: displays the state of the current stack frame.
Commands to use in the GDB debugger
| Command | Description |
|---|---|
| help | Provides information about a topic or commands you can use |
| file | Indicates which file to debug |
| run | Executes the program under GDB |
| break | Adds breakpoints to stop the program execution temporary |
| delete | Deletes breakpoints |
| clear | Deletes breakpoints for a specific function |
| continue | Resets the program after a breakpoint triggers |
| step | Runs the current source line and stops before executing the next one |
| next | Runs the current source line. However, if the line is a function call, the debugger will fully execute the function before the execution stops again |
| until | Runs the current source line. If you are at the beginning of a loop, the debugger runs until the loop ends |
| list | Prints a certain list from the source code |
| Prints values of certain expressions |
Other C++ debuggers to consider
- Visual Studio has an integrated C++ debugger that lets you analyze code on the most popular operating systems such as Linux, Windows, macOS.
- LLDB debugger is a modern debugger that has reusable components that employ libraries from LLVM.
- WinDbg is a debugger for the Microsoft Windows operating systems.
