 HTML
HTML  CSS
CSS  PHP
PHP  JavaScript
  SQL
SQL  Bootstrap
  Solidity
  jQuery
  Git
Git  Chrome DevTools
  C++
C++  Python
 DevTools in Chrome are feature-rich: you can perform many tasks without having to leave the browser. The Chrome debugger function is one of the most appreciated components that this built-in tool offers. If you have not learned how to debug JavaScript in Chrome, we encourage you to master DevTools and learn to fix bugs faster.
The Chrome debugger in DevTools presents you with functions that are designed to help you find errors, inspect them, collect information about exceptions and set breakpoints. A combination of all of these features will allow you to use DevTools as an efficient JavaScript debugger.
All of these debugging-oriented actions are performed in the Sources panel which we have thoroughly explained in one of our tutorials. Before you start using the JavaScript debugger, you should learn the principles and features of the Source panel.
This tutorial on how to debug JavaScript in Chrome provides instructions on setting breakpoints. In other words, how to pause JavaScript code and inspect specific lines to find errors. During the code analysis, you will be able to investigate expressions and their values, call stacks and variables.
Your page is no place for JavaScript bugs: don’t let errors spoil the fun of creating high-performance websites!
Contents
Chrome Debugger: Main Tips
- In this tutorial, we will show you how you can use DevTools as Chrome JavaScript debugger.
- The word debugging refers to a process of analyzing bits of code. You can set breakpoints at specific moments to focus on specific lines.
Debugging With Breakpoints
When you deal with errors or need to get insight into how your JavaScript code works, Chrome debugger provides an array of functions, helping you detect and solve issues.
Sources panel allows you to set breakpoints at specific events and to see what is going on with the code at that moment.
You will discover which variables are defined, their values, and what can be found on the call stack. You can even save expressions and monitor their values throughout the code execution.
If you have read our previous tutorial on the Sources panel, you should be familiar with all of the basic features of this Chrome tab.
We will now look at this panel in more detail, in the context of debugging.
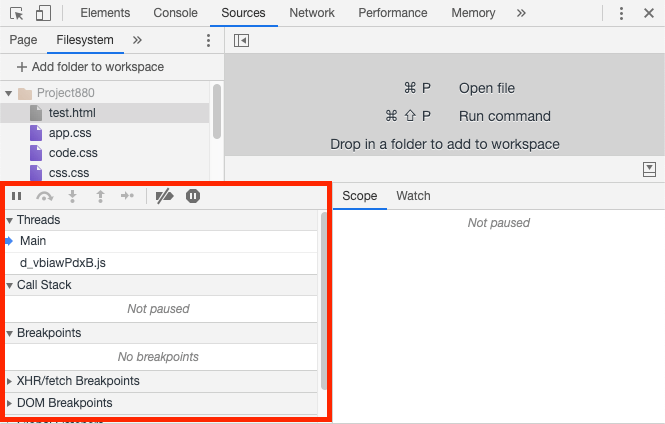
We should begin by showing you the Chrome debugger pane, located farthest to the left. This is the location of the pane when the DevTools take less space in the browser:
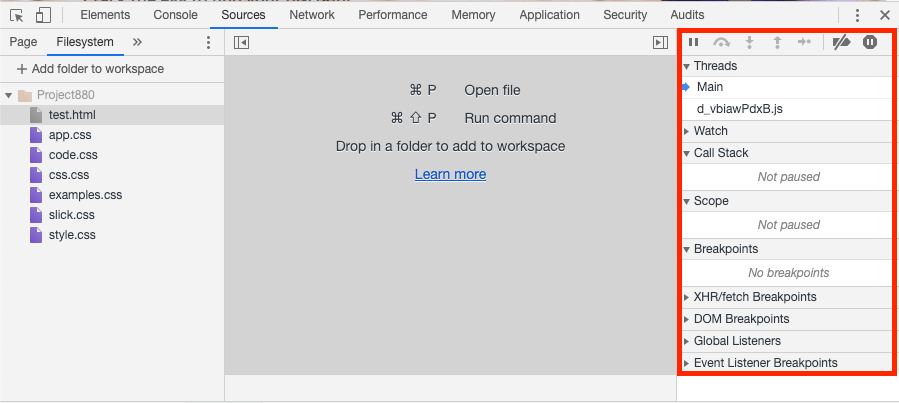
When the DevTools are broader, the pane will be found of the right side:
- Easy to use with a learn-by-doing approach
- Offers quality content
- Gamified in-browser coding experience
- The price matches the quality
- Suitable for learners ranging from beginner to advanced
- Free certificates of completion
- Focused on data science skills
- Flexible learning timetable
- Simplistic design (no unnecessary information)
- High-quality courses (even the free ones)
- Variety of features
- Nanodegree programs
- Suitable for enterprises
- Paid Certificates of completion
- A wide range of learning programs
- University-level courses
- Easy to navigate
- Verified certificates
- Free learning track available
- University-level courses
- Suitable for enterprises
- Verified certificates of completion
Debugging Pane Explained
Firstly, you need to open the Sources panel and look at the debugging pane.

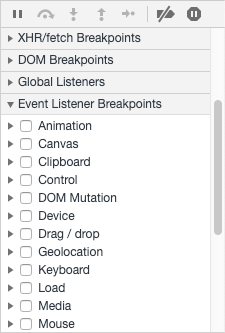
This pane features sections, containing various event listener breakpoints, which can be used to pause the code.
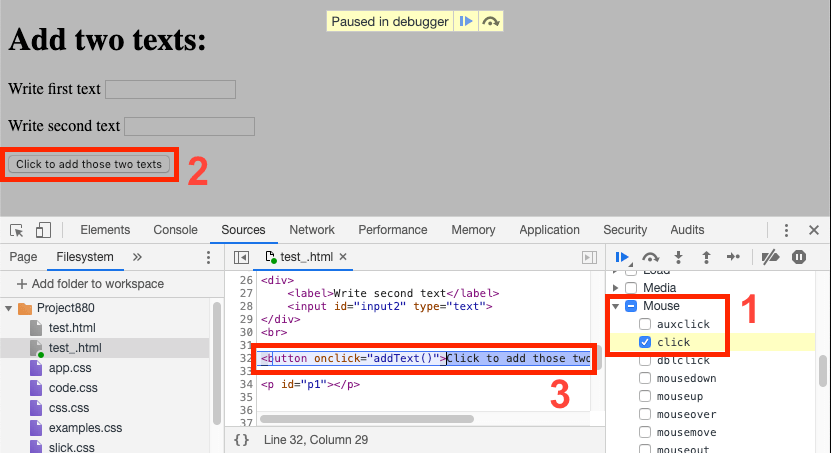
For example, you can select the click event. If you click any of the elements that have the click event listener, the JavaScript will pause. We use this JavaScript code to illustrate this example:
function addText () {
	var firstWord = document.getElementById("input1").value;
	var secondWord = document.getElementById("input2").value;
	document.getElementById("p1").innerHTML = firstWord + " " + secondWord;
}
<h1>Add two texts:</h1>
<div>
	<label>Write first text</label>
	<input id="input1" type="text">
</div>
<br>
<div>
	<label>Write second text</label>
	<input id="input2" type="text">
</div>
<br>

<button onclick="addText()">Click to add those two texts</button>

<p id="p1"></p>
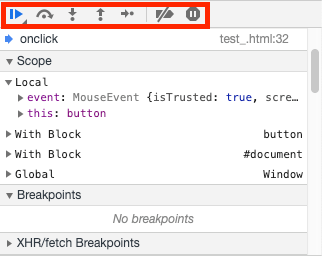
In the provided code snippet, we checked the click event. After the button to stop execution is clicked, you can see that a line, containing the click event, is highlighted.
When the code execution is paused, you have four options (from left to right):
- Resume Script Execution: resumes script execution.
- Step over Next Function Call: jumps to the end of the current function. If it is at the end of the current one, it will move to the end of the following function.
- Step into Next Function Call: jumps to the next line of code.
- Step out of Current Function Call: executes the rest of the current function's code.
- Deactivate Breakpoints: disables the breakpoints you had set up.
- Don't Pause on Exceptions: does not pause to show exceptions that occur during execution.
Analysing the Execution and Breakpoints
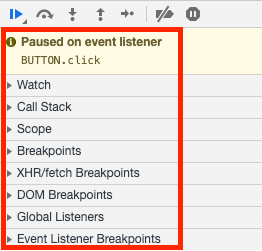
Now, it may be helpful to look at the other sections on the sidebar (discussed from top to bottom):
- Threads: allows you to analyze other threads like web workers.
- Watch: you can enter expressions and see their values.
- Call Stack: lets you inspect the call stack you got before the code was paused.
- Scope: you can find and change values of properties and objects in global, local, and closure scopes.
- Breakpoints: this section allows you to manage the breakpoints you have set. To set a breakpoint, you should follow these steps:
- Go to the Sources panel.
- Select the file you want to add a breakpoint to.
- Right-click the line you want to add a breakpoint to.
- Now, the breakpoint line is highlighted by a blue icon on the right side of the line and shown in the Breakpoints section of the debugging pane.
- XHR/fetch Breakpoints: this contains the breakpoints you can set if pages are requesting wrong URL. You can set such breakpoints by:
- Clicking the plus shaped icon that appears on the right side of the section after you expand it.
- Entering a phrase you want to find.
- The breakpoint should be listed successfully. Whenever an URL of XHR requests contains the phrase you entered, the code execution will be paused.
- DOM Breakpoints: this contains the custom breakpoints you set when you want to stop on the code, modifying DOM. Do this by:
- Going to the Elements panel.
- Selecting the DOM element you want to set a breakpoint to.
- Selecting the type of breakpoint you want to apply.
- Global Listeners: this section contains all of the active event listeners on the page. They are sorted by their type.
- Event Listeners Breakpoints: lets you select from various event types to specify on which events code should be paused.
Chrome Debugger: Summary
- This tutorial, explained how developers can debug JavaScript with the help of the Sources panel in DevTools.
- The debbuging process in Chrome debugger pane is done by setting breakpoints that allow you to closely inspect lines of code.
