


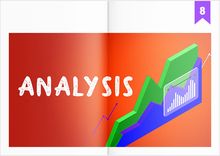

What is Golden Cross?
Let's find out Golden Cross meaning, definition in crypto, what is Golden Cross, and all other detailed facts.
A golden cross is a chart pattern that occurs when the short-term moving average crosses over the long-term moving average. In other words, the golden cross is a bullish breakout structure formed when a security's short-term moving average crosses beyond its long-term moving average or barrier properties level.
The most widely-used moving average setting is the 50-day moving average and the 200-day moving average.
The Trading Technique of the Golden Cross
The most secure and widely-used technique is to make an entry into the market at the same time the golden cross is created. Nevertheless, a few traders also step into the market as soon as the moving averages move in a direction to create the golden cross to earn the benefit of entering the market prior to the creation.
The majority of traders utilize the golden cross with multiple technical indicators to evaluate the volume and price activity from different angles prior to deciding on whether to buy or sell.
Moving average convergence divergence (MACD), on-balance volume (OBV), accumulation/distribution indicator, relative strength index (RSI), and the stochastic oscillator are among the technical indicators.
The Three Main Stages of the Golden Cross
The first phase denotes the conclusion of the downtrend as the gap (denoting volume) in the 50-day and 200-day moving averages begins to narrow.
The 50-day moving average meets the 200-day moving average to produce a golden cross in the second phase.
The final phase is the upswing that occurs following the appearance of the golden cross. This is generally an excellent time to invest in an asset to get the most rewards as the rise unfolds.
For many traders, a golden cross is the most conclusive evidence of a bull market and a powerful purchasing indicator. Yet, for others, it is merely a verification instead of a signal to enter the market. Expert traders suggest not to use the golden cross as a stand-alone trading signal, but rather as part of a strategy.
Can Traders Trust the Golden Cross?
When it comes to the golden cross indication, there could be doubt and disagreement among financial professionals. Nonetheless, it has done exceptionally well in recent years.
The S&P index, for instance, rose by more than 50% since the last golden cross shown on its trading graphs.