BitDegree Instructor Analytics: Track Your Students Easily
We highly doubt that all you care about is uploading your course to the platform and forgetting all about it. Any real e-teaching professional will want to see how their students are doing, track their progress, and monitor their earnings. However, this is one of the trickier parts of teaching online: your chances to keep an eye on your online course statistics entirely depend on the platform you choose for publishing your courses.
Luckily, you made a decision to teach students on BitDegree: aside from all the other advantages, you will also get to use extensive student progress and revenue reports.
The essential online course statistics
As soon as you step into the Instructor’s Studio, you will see a simple table with the most important information related to the courses you teach:
- Earned this month is the amount of money you have made for your courses this month. However, you cannot withdraw this amount just yet, as a student may apply for a refund 30 days after they make a purchase and pay in USD.
- Total Revenue defines the combined revenue from all the courses you have uploaded to the platform.
- Students Finished shows how many students have completed your courses up to this day.
- Total Students represents the total number of students enrolled in your courses.
- Available for Withdrawal is the total amount of money you earned 30 or more days ago and therefore can withdraw from the system. To do that, click the purple button Withdraw now below the sum, or select the Payouts tab on the left-hand menu.
- Average Ratings shows the average number of stars (1–5) your users choose when evaluating your courses.
Most of the instructors agree these online course statistics are the most important to track constantly – that’s why we added it to the dashboard for quick and easy referral. However, it’s far from everything you can monitor on the BitDegree’s platform!
Understanding the student progress report
As you select the Students tab on the left-hand menu, you will be able to:
- review the data that relates to either the students of all of your courses (default option)
- choose one particular course in the dropdown menu at the top of the page
At the top of the page, you will find Top Geographies. This panel shows the countries where your courses are watched the most (notice that it refers to the time spent watching, not the number of enrollments). Why is this important? First, knowing this can help you adjust your marketing strategy. For example, if you notice your course goes unnoticed in India, it might be smart to work on your Facebook advertising (according to Statista, Indians make up the biggest part of Facebook users) and maybe even think of location-specific Facebook ads. Another excellent option is to keep the most active users in mind when you’re creating new content: you can adapt some examples or illustrations a little, so the user feels an instant connection. Let’s say you’re explaining how to create fan art – why not choose a particular character that’s very popular among your users for a practical example? Knowing your audience is a must when you want to build a strong connection to them, and their cultural background is a big part of that.
Right next to the Top Geographies panel, you will see the basic online course statistics that are related to the students:
- Total Students
- Enrolled
- Learning
- Finished
Each of these metrics will be defined in an exact number and percentage – the latter will represent the change since the previous week, so you can track the changes in real time. This is a quick way to notice if your numbers dip and take action! Below the numbers of students, you will find the average student progress reported, as well as the average time they spend on the platform and their average score (if you include tests in your courses for evaluation on student progress).
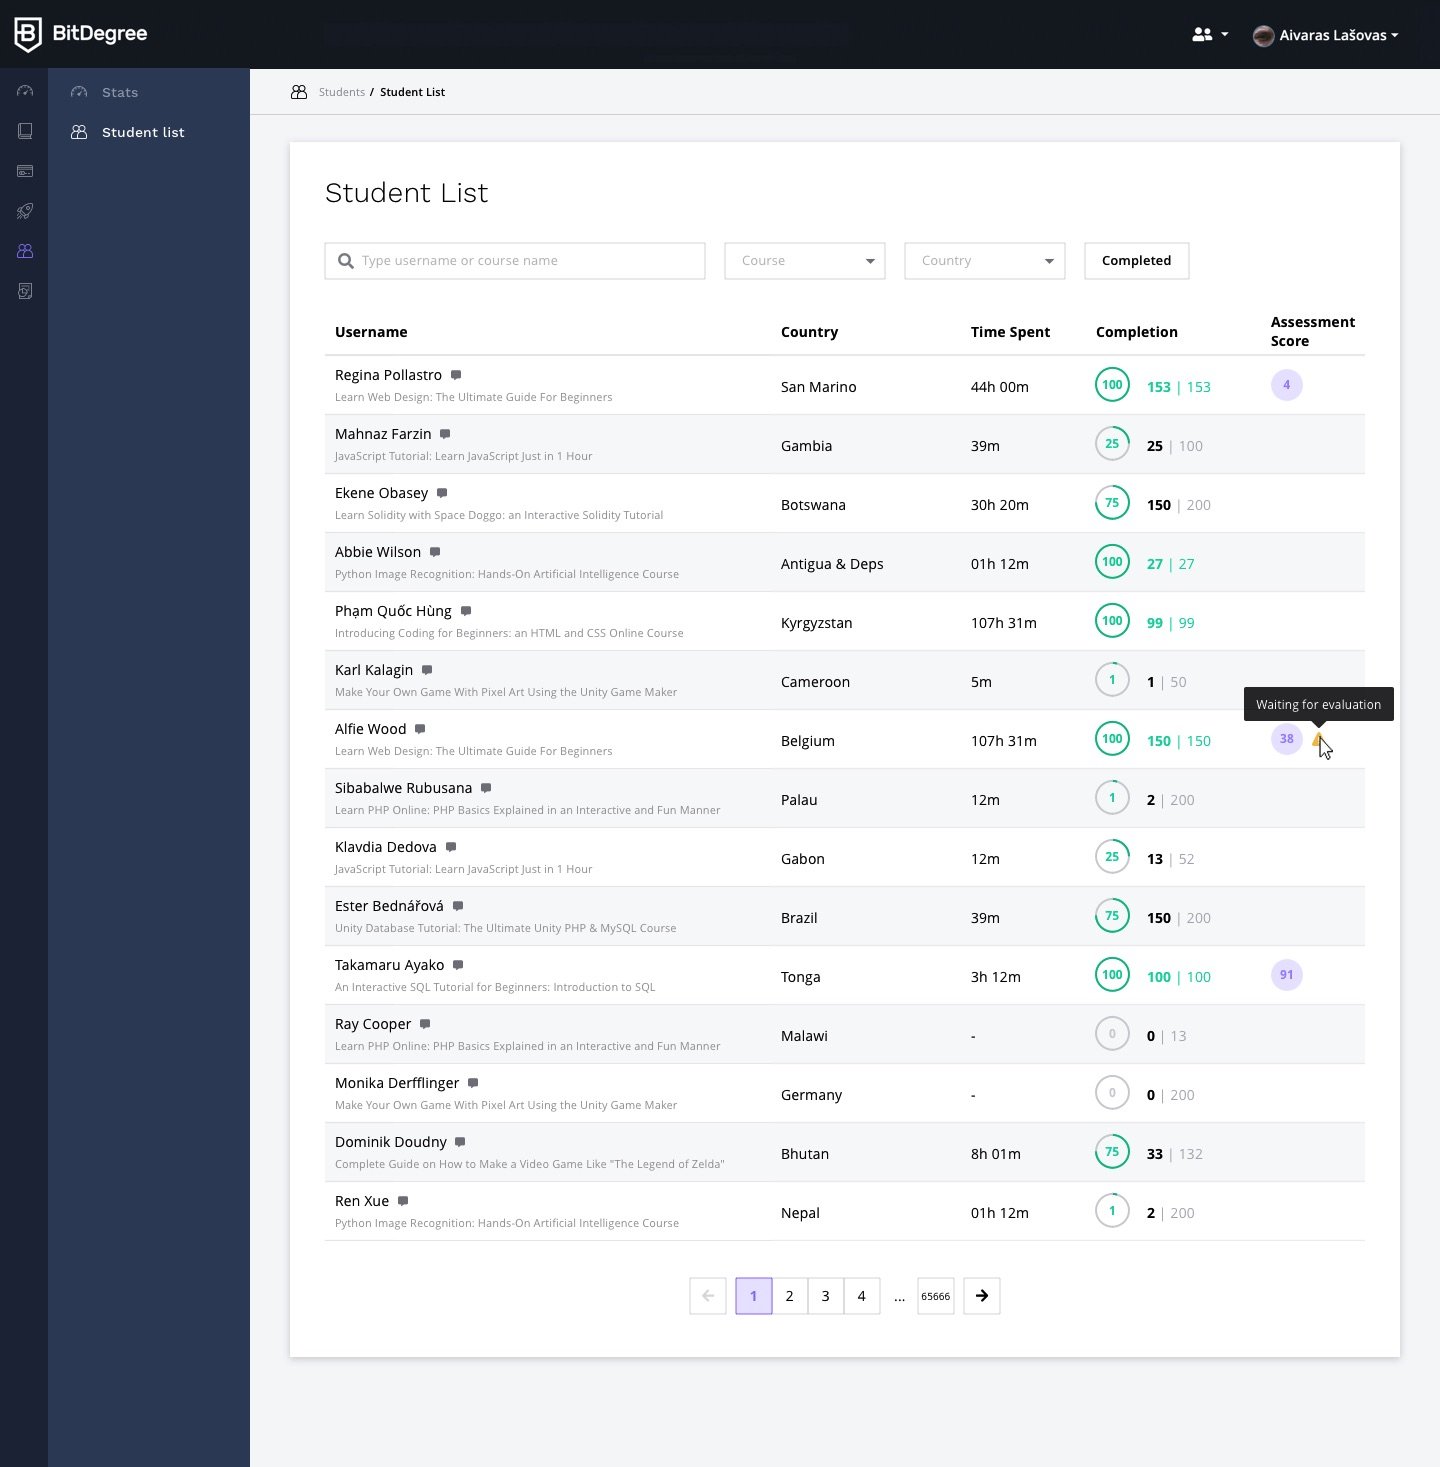
Below, you will find a comprehensive Student List. You can choose to filter only the students of a specific course or country. The data of the student progress report will be conveniently displayed in five columns:
- Username – the unique username of an individual student. The course they have enrolled in will be shown in smaller letters under the name.
- Country – the location of said student
- Time Spent – the number of hours and minutes the student has spent in your courses. This might be one of the most crucial online course statistics: if the number seems disproportionate, you might want to rethink your presentation.
- Completion – the percentage and the exact amount of the lectures completed.
- Assessment Score – if your course includes quizzes or other tasks for evaluation on student progress, their scores will be displayed in this section.
You can also use the search function to find a specific user on the list. Being able to monitor the students’ progress carefully is especially important for educators who use the BitDegree platform to replace or enrich the traditional learning experience. If all of your students start the course at the same time and the online course statistics show a very different stage of progress after a while, this might mean a certain student needs some more help to understand the content fully.
Orders and revenue report
The very last tab on the left-hand menu is called Sales & Marketing. This is where you’ll find all the online course statistics that have to do with your earnings. As soon as you open the tab, you will see three sections – Promo Codes, Sales Report, and Orders. In the first one, you would create promo codes for your courses – however, we’re not here for that this time.
When you open the Sales Report section, you will see five distinct columns:
- New Students
- Orders
- Earnings
- Revenue
- Refunds
Each of the names is rather self-explanatory, right? Now notice that you can actually click on any of these columns and see the particular online course statistics depicted in a graph. You can also choose it to only represent the data related to a specific course and define a period of time. For the Orders, Earnings, Revenue, and Refunds columns, you can also specify a sales channel. Graphic tools make it very easy to notice changes – e.g., it takes seconds to see whether the number of orders has risen since you shared a specific promo code and if the strategy to sell the course to more people for a smaller price paid off!
Now, in the Orders section, you will see a complete list of all the orders your students have made. You can filter the list based on the customer name, course name, channel, and date. The list contains comprehensive online course statistics, including the date of the purchase, the name of the customer, the course bought, the sales channel, the amount of money paid, your revenue, and the promo code (if used). Analyzing the data allows you to identify the most lucrative courses and subjects, as well as the best-converting sales channels.
The more you learn about your courses and users, the better you know what could still be improved, polished, and updated. Thanks to the exhaustive tools BitDegree offers for analytics, there’s no need to master any complex systems and programs to see the results – all the online course statistics can be found in the Instructor’s Studio at any convenient time.