 HTML
HTML  CSS
CSS  PHP
PHP  JavaScript
  SQL
SQL  Bootstrap
  Solidity
  jQuery
  Git
Git  Chrome DevTools
  C++
C++  Python
 Chrome DevTools Console is a panel for logging messages, debugging applications, and analyzing variables. This panel allows writing and executing JavaScript.
Contents
Chrome Console Log: Main Tips
- Console panel helps to diagnose issues related to the execution of code.
- These Chrome logs let you analyze variables at specific moments of execution.
Logging: Print Messages to Console
To perform basic Chrome DevTools logging, use the console.log JavaScript method.
Note: for logging arrays, you should use console.table to get more neatly organized data.
JavaScript console.log method takes one or more parameters, ranging from strings and JavaScript objects to other types of expressions.
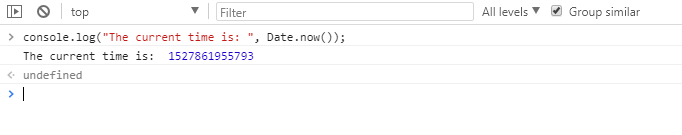
Take a look at an example of the console.log which prints messages to the Console:
console.log("The current time is: ", Date.now());
The command will output this:
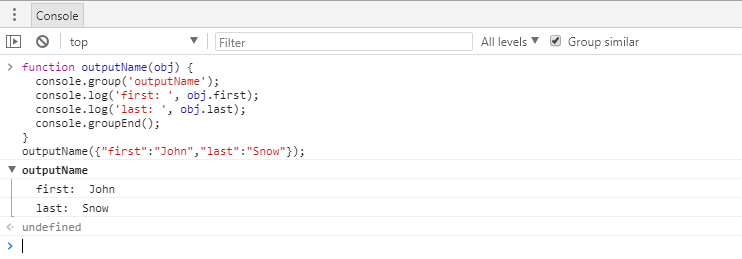
Tip: it is useful to place variable names in {} in the console.log method of JavaScript to get the full information. In this way, you will receive variables with their values.
To clear the console of all printed messages, use console.clear().
Autocomplete Commands
The Chrome Console log also displays a drop-down menu with suggestions based on previously written code. As a result, it saves you time typing or copying commands.
Commands for Logging Errors
Additionally, you have the methods console.error() and console.warn(). This Chrome logging makes messages stand out from the rest.
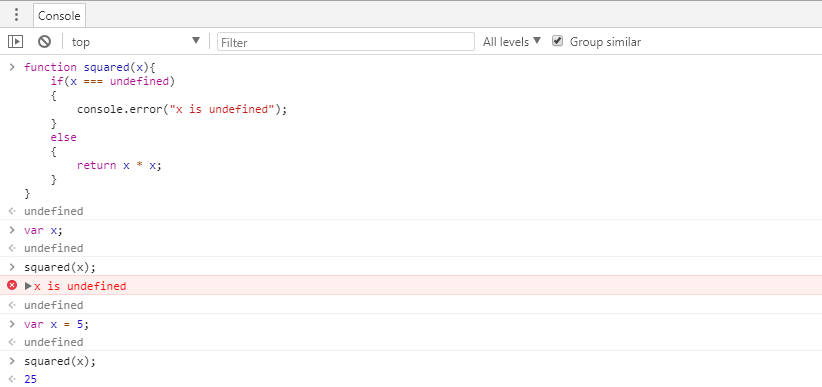
Here is an example of console.error() inside the console:
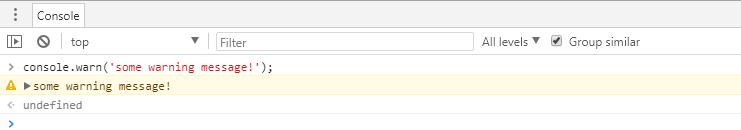
Now, take a look at how the console.warn() output is displayed:
Tip: the console.trace() helps to find more information about the way the method was invoked and executed. It shows the order in which functions executed.
Assert
Alternatively, console.assert() lets you log errors conditionally. This Chrome logging method causes an error to pop up if the specified condition returns false.
Two parameters are taken for this method: the condition and the message to display if the condition is not met.
Here is an example of how it looks inside the console:
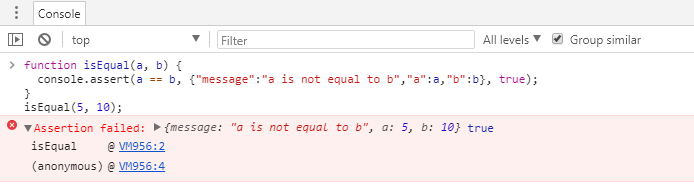
Simply put, we have the boolean variable named condition, and its value is false. The condition of console.assert() checks if it is true. Since that condition is not met, it displays a Chrome error log.
- Easy to use with a learn-by-doing approach
- Offers quality content
- Gamified in-browser coding experience
- The price matches the quality
- Suitable for learners ranging from beginner to advanced
- Free certificates of completion
- Focused on data science skills
- Flexible learning timetable
- Simplistic design (no unnecessary information)
- High-quality courses (even the free ones)
- Variety of features
- Nanodegree programs
- Suitable for enterprises
- Paid Certificates of completion
- Easy to navigate
- No technical issues
- Seems to care about its users
- Huge variety of courses
- 30-day refund policy
- Free certificates of completion
Methods for Grouping Logs
The methods console.group() and console.groupEnd() are for sorting Chrome logs.
To begin, you use console.group(), which takes a single parameter. This parameter is for naming the group of logs.
All matching Chrome logs after that will be put into the group you created.
The grouping ends console.groupEnd() command.
Take a look at how this sorting looks inside the console:
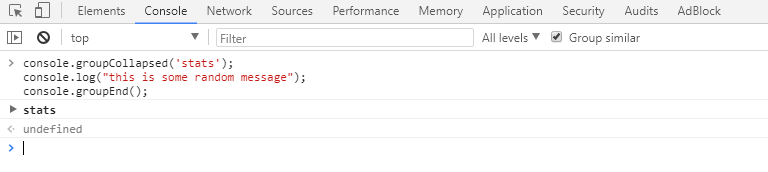
Alternatively, you can start a group with the group collapsed initially if you do not need everything that is being logged visible. console.groupCollapsed performs this action:
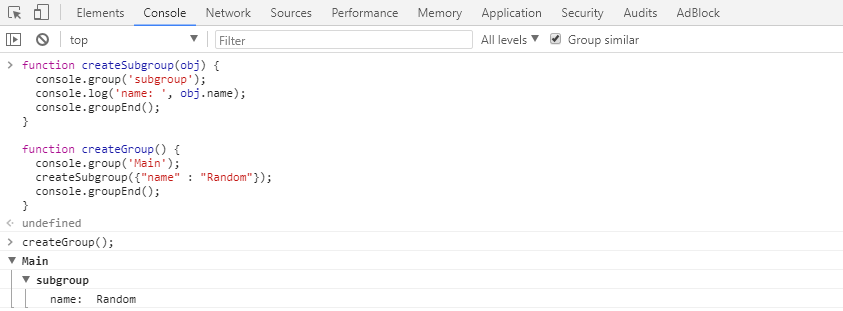
You can also nest groups of Chrome Console logs. It is useful for when you need to have a large group of logs displayed in smaller, convenient pieces:
Formating: Use of Format Specifiers
The first output message parameter of the console.log() method can contain format specifiers.
Format specifiers are for indicating the formatting applied to a value.
Here is a list of possible specifiers:
| Specifier | Output |
|---|---|
| %s | Sets value format to string |
| %i or %d | Sets value format to integer |
| %f | Sets value format to floating-point value |
| %o | Sets value format to an expandable DOM element, as shown in the elements panel |
| %O | Sets value format to an expandable JavaScript object |
| %c | Apply CSS to the output text, as the second parameter dicta |
Let us take a look at a simple example, illustrating the use of specifiers:
console.log("Hello, %s !", "World");
The output message of this code is Hello, World !. You can view the format specifier as a placeholder for a certain value.
Also, we can see that the value to insert in the place of the specifier is the following parameter of the function.
Parameter values are listed in the same order as they were in the first parameter.
Here is an example to illustrate this as well:
console.log("My name is %s and I'm %i years old.", "John Doe", "30");
As a result, the output of this one will be My name is John Doe and I'm 30 years old.
Notice how we used different specifiers to indicate that the format of these parameters is different. %s indicated it had to be a string and %i indicated it had to be an integer.
Style Output
The CSS you input as the second parameter when you use the %c format specifier applies to the line of text that you included the format specifier.
To make this more clear, we should take a look at an example:
console.log("%cThis will be formatted with large, red text", "color: red; font-size: 30px");
This is how it will look in the console:
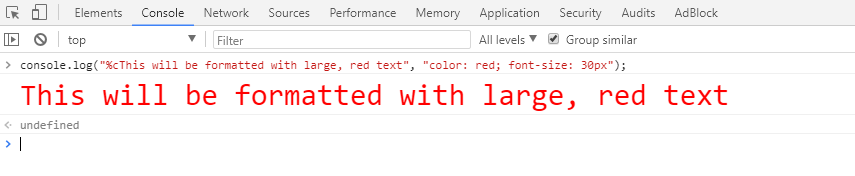
Tip: styling Chrome Console logs is useful if you want messages to stand out visually.
Format DOM As JavaScript Objects
By default, the console logs DOM objects as represented by their HTML. However, you can log them as JavaScript objects. This is done via the %o specifier or using the console.dir command.
Chrome Console Log: Summary
- When JavaScript is not working properly, open DevTools Console panel and see the logged messages.
- You can sort Chrome logs, style them, or mark them as errors.