 HTML
HTML  CSS
CSS  PHP
PHP  JavaScript
  SQL
SQL  Bootstrap
  Solidity
  jQuery
  Git
Git  Chrome DevTools
  C++
C++  Python
 Chrome Developer Tools have another highly-rated component called the Sources panel. It is designed to provide information about all of the files that are uploaded into websites. The panel also helps developers to edit webpage Chrome, and make changes to the JavaScript and CSS files.
To edit HTML in Chrome and keep the changes you want, you should know how the Sources panel is used. If you make modifications to HTML code on the Elements panel, your changes will be lost.
Furthermore, if you reuse the same code for different pages, you can simplify this repetitive code-writing process with the Sources panel. It has a built-in editor called the snippet feature which allows you to create and save a part of your code.
Therefore, Chrome snippets (bits of saved JavaScript code) can be repeatedly used on many pages. Save snippets of code to efficiently organize your time and update websites without having to write the same code all over again.
Additionally, you can add breakpoints into code snippets to pause JavaScript code. Breakpoints allow you to test JavaScript in browser to make sure that code is bug-free.
This tutorial will explain all of the features, allowing you to edit webpage Chrome faster. We will cover Chrome snippets feature in more detail, and introduce you to the structure of the Sources panel.
Contents
Chrome DevTools Sources: Main Tips
- In this tutorial, we will do an overview of the Sources panel of the Chrome Developer Tools.
- The Sources panel is divided into three panes, all of which are meant for inspecting the files that the currently loaded page is using.
- Snippet of code is a useful feature, allowing you to add the same code to many pages.
Sources Panel Explained
The Sources panel can be used for multiple things when it comes to developing your web applications and web pages.
The main functions of the Sources panel are the following:
- Editing JavaScript and CSS.
- Setting up Workspace so the changes you make in DevTools would be saved on your file system.
- Creating and saving JavaScript snippets.
- Debugging JavaScript.
- Viewing the files that the loaded page consists of.
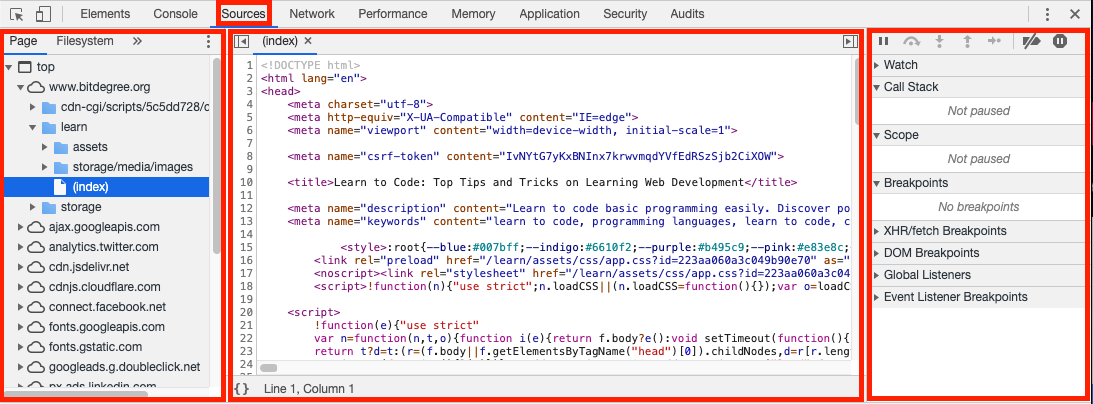
Network Pane: Inspect Page Resources
The leftmost part of the Sources panel is used for displaying the files that are loaded for the current web page.
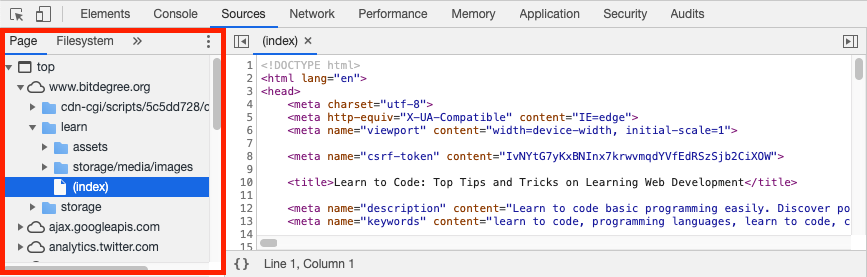
This pane is displayed according to a certain structure:
- The top level, top, represents the HTML frame or the default context, being the currently loaded web page, or the main document frame.
- The second level is refered to as the origin and is the name of your domain.
- The level below is loaded from the origin. It includes the JavaScript, CSS files, and other resources.
You can double-click on the files in this pane to display and edit their contents in the Editor.
- Easy to use with a learn-by-doing approach
- Offers quality content
- Gamified in-browser coding experience
- The price matches the quality
- Suitable for learners ranging from beginner to advanced
- Free certificates of completion
- Focused on data science skills
- Flexible learning timetable
- Simplistic design (no unnecessary information)
- High-quality courses (even the free ones)
- Variety of features
- Nanodegree programs
- Suitable for enterprises
- Paid Certificates of completion
- Easy to navigate
- No technical issues
- Seems to care about its users
- Huge variety of courses
- 30-day refund policy
- Free certificates of completion
Editor Pane: Modify JavaScript and CSS
The Sources panel is also used for editing the JavaScript and CSS files you select. Therefore, the middle section of the panel is referred to as the Editor pane.
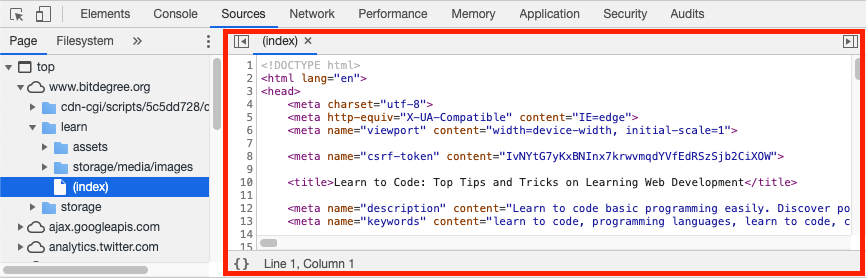
As the title suggests, you can use it as a code editor. With some adjustments, you can save the changes you make to your page.
Another helpful feature is that the changes you make to CSS files are displayed right away (same as in the Elements panel).
However, it is slightly different for JavaScript. To apply the changes (note that the whole script does not get applied again, only the changes), you must press CTRL + S for Windows and Linux and CMD + S for Mac OS.
By default, these changes are removed when the page is reloaded.
To save the changes, made using Chome Developer Tools, you need to set up a Workspace.
Usage of JavaScript Code Snippets
Using the Sources panel you can create, save and run JavaScript snippets.
Snippets are bits of code you can repeatedly use on any page! This feature will allow you to edit webpage Chrome faster as you won't have re-write the same code on several pages.
Firstly, to create a snippet, select Snippets in the horizontal menu in the Networks pane.
From there, you can click New snippet and start writing code!
After you are done, you need to right-click the snippet in the menu and select Run.
Debugging JavaScript Options
The Sources panel is also useful for debugging JavaScript.
This is a good alternative for using console.log() to check whether your code is running correctly. You can also set breakpoints for this purpose.
The breakpoints allow you to stop the execution of code at certain places so you can inspect and interact with the values used. However, breakpoints require a separate tutorial because of their complexity.
Chrome DevTools Sources: Summary
- This tutorial covered the main aspects of the Sources panel of the Chrome Developer Tools.
- The Sources panel consists of three panes that are designed to help you edit and run JavaScript and CSS files, and solve issues in JavaScript code.
- Code snippets feature can help you use the same code in multiple pages without having to write it again on a different page.